Category Archives: VP Macros

Calculate Emergence with “check for a term to grow”


This version incorporates the new check for a term to grow at 1.5 times the overall dataset growth in place of the 2:1 Analysis:Base Year record count ratio requirement.

There is no change to the scoring calculation used in this VPInstitute version and the Calculate Emergence Indicators version executed from the toolbar of VP Student Edition or VantagePoint. The change in this VPInstitute version of the script applies to how the terms are filtered to remove “common” terms in relation to the dataset. This version checks that each term is growing faster in use than the growth of the overall dataset.

Calculate Emergence Indicators zip file

A few caveats to use it:

  1. Once downloaded, unzip and drop into the VantagePoint\Macros installation directory. Note that it’s possible some files will be either blocked by Windows – thus will need to right click the file->Properties->Click Unblock.
  2. It’s also possible that some of the files will be given an “unsafe” file extension. Literally something like “Emergence.html.unsafe”. If that is the case you will need to rename the file and remove the “.unsafe” bit at the end. Windows will warn you about doing this but go ahead anyway. If you hit any errors trying to run the script or something isn’t loading right then 1 or 2 is likely the cause.
  3. If you are comparing results of this version with the commercial version of the script, and you’ve selected the same Term and Year field, then the score for a given term should be the same between the two versions. It just might not appear in both lists due to the change in filtering. Which version is “right” is subjective in this case.

EScore Heatmap

This script can be used to create a heat map of the technical emergence indicator (EScore) generated in VantagePoint.

Login to view. Login to view.

To use:

  • Copy the attached .vpm and .xlsm files to an empty folder
  • Copy a VantagePoint file with a Country and Emergence Score compound field to the same folder (or any compound field containing country-level data)
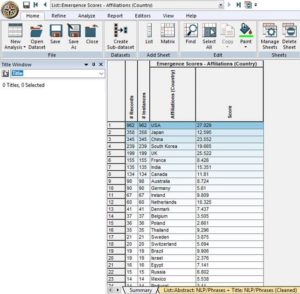
  • Open this field. It will look similar to this:

  • Select the list items you’d like to see mapped and then run the attached .vpm
  • Your browser will automatically launch and display a heatmap for selected list items. If you hover your mouse over a given country its score will appear. If you click on a given country your browser will zoom in to and center on this country. If you click on the home icon (in the top left of the screen) the map will reset.

Collaboration LineStrings for Google Earth and Google Maps

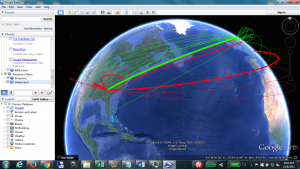
LineStrings sript useful for viewing collaborations in Google Earth and Google Maps. LineString widths are assigned sizes proportional to the number of records associated with a given collaboration (i.e. an LineString affiliated with 10 records would be twice as thick as one affiliated with 5 records).  The following instructions provide guidance for installing and using this tool.

Installing the Script

  1. If you have not done so already, install Google Earth on your personal computer (it can be downloaded free of charge at: http://earth.google.com/). [It is advisable to disable the “show tips at startup” pop up box (which is set to appear by default when Google Earth is first launched)]
  2.  Save these 3 files to an empty folder on your computer:
    1. LineStrings.xlsm
    2. Download Login to view.
    3. Download Login to view.
  3. Excel macros need to be enabled to use this program.
    1. Open the macro security settings dialog box from the Developer tab in the Ribbon. If the Developer tab is not visible, click the Microsoft Office Button, then click Excel Options. Under the Popular option select the Show Developer tab in the Ribbon check box. Once the Developer tab is visible, click the Macro Security icon:
    2. Select: “Enable all macros,” then click “OK” (note: this allows Excel to run potentially harmful scripts on your computer. If you are not familiar with, or do not trust the source of a given Excel file, scan it for viruses and/or disable macros before opening it).

Using the LineStrings Script

  1. Copy the files for this script to the same directory containing the .vpt file whose collaborations you want to visualize.
  2. Open your .vpt file and create a matrix of collaborations – an ideal matrix for this script has one row (for a given individual or affiliation) and multiple columns (for collaborators).
  3. Run the .vpm with the matrix as your activesheet in VP. You’ll be prompted for a maximum altitude. A good selection is 600,000, but if you select ‘no’ your linestrings will be clamped to the ground. You’ll also be prompted for linestring width (linestring widths are set proportional to record counts). 3.0 or less would be a relatively thin width, and vice versa. You’ll also be prompted for linestring color and a filename.
  4. After making your selections a .kml file is generated (in the same directory housing your .vpt file), which can be viewed not only in Google Earth but also in Google Maps–if you upload this file to gpsvisualizer.com you can render your map Google Maps (or 2D format). As was the case with VP_to_GE.xlsm, if any list items don’t map you can add affiliation names (from your VantagePoint file) and their latitude/longitude coordinates to the Coordinates sheet (in LineStrings.xlsm). You’ll know if any list items do not map because their names will appear in the LIST ITEMS NOT MAPPED sheet of LineStrings.xlsm.

Navigating Google Earth

Google Earth is easy to navigate.  For a detailed list of all navigation techniques visit:

http://earth.google.com/userguide/v4/tutorials/navigating.html

An abbreviated set of basic navigational instructions appear below:

– Use the arrow keys to scroll up, down, right or left (or click & drag your mouse).
– Scroll the mouse wheel up or down to zoom in or out.
– Press “N” to reorient the globe due-north.
– To make the globe spin about its vertical axis open World Tour.kml in Google Earth

Created by: Stephen Carley (stephen.carley@searchtech.com)

Calculating the Integration Score using WoS dataset

Integration scores are useful for calculating diversity among cited references.
Before calculating Integration scores you need the following files in the following directories:
1. CreateCitedWCs.vpm in your C:\Program Files\VantagePoint\Macros folder

Download Login to view.

2. Calculate Integration Only v2.vpm in your C:\Program Files\VantagePoint\Macros folder

Download Login to view.

3. J-WC-Current.the in your C:\Program Files\VantagePoint\Thesaurus folder

Download Login to view.

4. Subject category correlations.xls in your C:\Program Files\VantagePoint\Macros\Resource folder

Download Login to view.

To calculate Integration scores:
A. Open VantagePoint Web of Science data file. These can be for multiple papers (or aggregations thereof, e.g., multiple authors).
[We can calculate metrics on a per-paper or a per-author (or other grouping) basis.]
Make sure the VantagePoint file name is not too long (maybe 26 character max)
B. Check that the Cited Journal field with NAS F/R exists. If it doesn’t, import it
C. Check that the Cited WC’s field exists. If it doesn’t, run the CreateCitedWCs.vpm macro (if prompted for a field, point to the Cited Journal field with NAS F/R)
D. ** Check that each record has at least 3 Cited WC’s.
a. To check manually: in VantagePoint, generate matrix of Unique Article ID (or Author) by Cited WC INSTANCES. Paste into Excel; Sum Cited WC instances. Sort on Sum. Mark those with fewer than 3 for exclusion. I like to make a group in the ISI Unique Identifier List and check those for exclusion; then create a sub-dataset without those, and proceed using that new VantagePoint file.
E. Create a VantagePoint field that only contains the items (i.e., your set of authors) for which you want to calculate Integration scores.
** This runs on the ENTIRE field you select. You can use “create field from group” to trim down your author (or ISI Unique Identifier) field first (e.g., to select the target group of authors from among all their co-authors).
F. Run the Integration score macro. Look for the Window in which you select what to use for each input box:
a. Authors field – e.g., unique paper titles (ISI Unique Identifier works well; if you want scores for each paper in a set – a good starting point; alternatively, you can calculate an Integration score for the consolidated papers of an entity, such as an author).
b. Cited WC field (for Integration scores)
G. Results will appear in an Excel file named after the VantagePoint file and field analyzed. The “Summary” sheet will list the entity (paper ISI Unique ID or Author name, etc.) and the IDR metric(s). The Correlation Sheet is used in the calculations (see “B” above).
H. If you run again, make sure that output Excel file is first renamed or moved (the macro won’t run if it exists in place).

script for GENERATING A VOSVIEWER NETWORK FILE FROM VANTAGEPOINT

STEPS FOR GENERATING A VOSVIEWER NETWORK FILE FROM VANTAGEPOINT:
1. Generate an empty folder and copy a VantagePoint file of interest to it.
2. Copy Generate_VOS_Network_from_VP.vpm and Generate_VOS_Network_from_VP.xlsm to this same folder.
3. In VantagePoint run the script Generate_VOS_Network_from_VP.vpm.
4. You will prompted to select a field of interest. Select the same one selected to generate a VOS map file.
5. The script will prompt you for a network name. Give it one.
6. After it the script completes a (sparse format) VOS network file will be saved to the same folder housing the VantagePoint file you’re working with.
7. Simultaneously open the accompanying map file and network file you just generated in VOS (under the File tab).
8. The user has the option to adjust number of lines (we suggest 200) on the map, as well as their color, width and whether they’re curved or straight.

An online VOSviewer manual, which provides in-depth guidance on VOS maps, networks and manipulation the same, is available at:
http://www.vosviewer.com/documentation/Manual_VOSviewer_1.6.4.pdf

Download Login to view.

Download Login to view.

One-click Patent Analysis using VantagePoint script and Excel template

In 2015 the patent informatics team at the UK-IPO were asked by the Government to produce patent analysis on over 45 different technology areas of interest to policy advisors. With a four-week deadline, such large volume patent analysis required a rethink in the way we produce analysis. The team have previously experimented with creating a number of VantagePoint scripts to help speed up specific steps within our processes for patent analysis but this project required a major step-change in how we use VantagePoint; a ‘one-click’ patent analysis that takes raw imported patent data and automates the creation of lists, applies thesauri, creates time-sliced subsets and populates a spreadsheet. It would have been impossible to deliver this work on time without automation.

The script expects the following fields to be present:

  • Patent assignees
  • Inventors
  • Publication country
  • Applicant country
  • Inventor Country
  • Priority country
  • IPC codes
  • Publication year
  • Priority year
  • Publication number

The script was generally used with datasets having many thousands of results, over a time spread of ten years. When run, you will need to select fields and enter how many results to show. You will also be prompted to save the files generated by the script when creating subsets.

The Excel template has named ranges programmed in. They are dynamic ranges which accept columns of any length, and the charts will automatically select the entire range.

Steps for use:

  • Download the script file Login to view.and Excel file Login to view. and save into Macros folder
  • Amend lines 197, 211, and 229 to have the correct path and filename for the thesauruses and Excel file on your computer.

It should then be ready to use. It will generate three excel files with a number of charts and tables in them.


VantagePoint Heatmap

Stephen Carley (via the VantagePoint Institute) is pleased to offer a heatmap program for viewing VantagePoint records in heatmap format. Maps are rendered using a color scheme of the user’s choice, with areas that exhibit more intense activity correlating with user designated hot colors (or hotspots). The following instructions provide guidance for installing and using this tool.

This link will provide complete Heat Map Instructions .

The following files are also required:

Login to view. Login to view.


To watch an instructional video on the VantagePoint Heatmap script go to VP Resources > VP How-To > Advanced Analytics
Viewing VantagePoint Files in Heatmap Format

ClusterSuite – term-clumping macro toolset

NOTE: The macro below will work for VantagePoint version 9 or earlier because of changes mandated by Chromium. For those with VantagePoint or VP Student Edition version 12 or later, use the “Refine NLP” function included with the software, it provides similar functionality. 

ClusterSuite is a macro which runs a series of thesauri, macros, and other term-cleaning and clustering programs to perform dimension reduction on a list, making it more approachable and manageable. It intends to minimize noise and maximize prominent topics, which enables the user to more quickly extract meaning from large amounts of text. More specifically, term clumping macros indicate (i) how closely related two or more terms are, (ii) a good name for a group that includes common terms, and (iii) the nature of the relationship between terms (e.g. parent-child, siblings, etc).

At present, ClusterSuite organizes its parts into three phases. Phase I executes five thesauri. Phase II iteratively runs a fuzzy list cleaning macro following a removal of extremely common or uncommon items. Phase III is designed to run a basic clustering macro after again removing extremely uncommon items. After the completion of these three steps, the user has the option to run an additional program to perform more advanced clustering.

1. Copy the Login to view. ‘ClusterSuite’ folder to C:\Program Files (x86)\VantagePoint
2. Copy Login to view.  to C:\Program Files (x86)\VantagePoint\Fuzzy
3. Copy Login to view. to C:\Program Files (x86)\VantagePoint\Macros
4. Open a VantagePoint file and run ClusterSuite.vpm (from C:\Program Files (x86)\VantagePoint\Macros)

ClusterSuite Tutorial PowerPoint

To watch an instructional video, goto VP Resources>VP How-To>Advanced Analytics
ClusterSuite Tutorial Video

Rough Guide to Dataflow in ClusterSuite

1)ClusterSuite.vpm calls the Tutorial.html (poorly named, I know) window
2)ClusterSuite runs a while loop that waits for Tutorial.html to send a window.status back to VantagePoint
3)Tutorial.html has multiple checkboxes each with their own ID.
4)When a button, such as “About ClusterSuite” or “Start” is presses, Tutorial.html updates the window.status. If “About ClusterSuite” is selected, the while loop continues to run while ClusterSuite launches another window. If “Start” is pressed, the while loop is stopped and ClusterSuite is told to record every checkbox ID with that is marked as checked. Additionally, the numbers from the Remove Extremes boxes are stored in an array.
5)The id of every checked box is stored in a giant array.
6)A for loop reads through each item in this array and executes the items in order. This prevents unchecked items from being executed.
7)Each component is executed in its own function, and the checklist is updated along the way.
8)At the end of this, the user is given the option of running TermCluster. If the user selects yes, a Term-Document matrix is created in ClusterSuite. This is then converted to Excel with a combination of a .vpm and .xlsm Matrix_to_columns macro.
9)Next, a  combination of runTermCluster.bat and .xlsm launch termCluster.jar.
10)TermCluster imports Excel, uses MySQL to store and manipulate it, and exports back to Excel

In order to use TermCluster, you first must install and configure MySQL, a free database from http://www.mysql.com/. Click here for a tutorial:
MySQL-Setup

Additional resources:
TermCluster data flow
Acronym_Eliminator_Instructions

Gmail Import to VantagePoint

The following provides guidance for exporting the content of a Gmail inbox to VantagePoint. To begin, start by creating a folder on your local drive and copying Gmail_Import_to_VP to this folder. Then take the following steps:

Step 1: Install Mozilla Thunderbird (https://www.mozilla.org/en-US/thunderbird/download) on your machine.

Step 2: Setup Thunderbird by providing it with a Gmail address and password.

Step 3: In Thunderbird install the Add-on ImportExportTools 3.2.1 (by selecting Tools > Add-ons, then search Extensions for the keyword ‘Export’. In the results list select ‘ImportExportTools’). After downloading this Add-on to your local disk, opening Add-ons from the Tools menu (Tools>Add-ons) and from the options button (adjacent to the search field) select “Install Add-on From File…”, then point to this Add-on. Thunderbird must be restarted for the installation to complete.

Note: Steps 1-3 only need to be performed once. After performing these all subsequent Gmail imports begin with Step 4.

Step 4: In Thunderbird click ‘Get Messages’, then right click your Inbox folder and select ImportExportTools >  Export all messages in the folder > Spreadsheet (CSV). You will be prompted for a folder to save the CVS export to. Save this file in the same folder as Gmail_Import_to_VP.xlsm.

Step 5: Open Gmail_Import_to_VP.xlsm and click the button ‘Gmail Import’ (note: macros need to be enabled in Excel for this script to run). The procedure that follows will generate a file in the same directory Gmail_Import_to_VP.xlsm named To_Import.xls. Launch VantagePoint and select ‘Import Database Table (Excel, Access, etc.)’. Next click ‘Browse’ and point to To_Import.xls.

Step 6: Once imported into VantagePoint some users find it useful to further process fielded values that are separated by commas (e.g. this can occur in the ‘TO’ field if there are multiple recipients for a given email). Some users also find it useful to create a folder titled ‘Exported Emails’ in Thunderbird and move all exported messages to this folder.

A training video using this script can be viewed at VP ” How-To”>Advanced Analytics  Importing E-mail into VantagePoint