Extended Abstract – NEW INDICATORS session at “1st Global TechMining Conference” 2011
Author(s): Ilya V. Ponomarev, Duane E. Williams, Joshua Schnell, Laurel L. Haak
Research progress may be either gradual or abrupt. While both ways are important, major advances in science strongly depend upon explosive breakthrough discoveries. Currently, analyses of emerging or breakthrough areas are rarely performed systematically and are almost always done retrospectively. We have developed several strategies for early detection of candidate breakthroughs, based on citation dynamics. Our findings can be used to inform portfolio planning practices and research management policies.
Breakthrough papers are rare events in science that are recognized retrospectively by the majority of the scientific community. The earlier these papers can be detected, the more time there may be to support an emerging research area through workshops, new funding, or collaborative research efforts. Identifying candidate breakthrough papers is a multidimensional process that involves several metrics, including cumulative citation counts, citation rates, recognition by leading experts, count and classifications of awards received, media coverage, and informal citations (names in titles and abstracts, newly coined words). In this paper we focus on ranked citation counts and monthly citation rates as proxies for scientific impact. Our goal is to identify candidate breakthroughs within a short time range after publication based on time dependent analysis of citation rates.
For our studies we evaluated annual data sets of research articles derived from Web of Science (WOS), published from 1999-2005 and acknowledged NIH funding support. We validated our findings using the 2005 data set (total 375,372 items). Our criterion for a candidate breakthrough was a paper that exceeded a certain threshold of cumulative citations count 5 years after publication. We found that for the threshold to be effective, it needed to factor in percentile and subject area category.
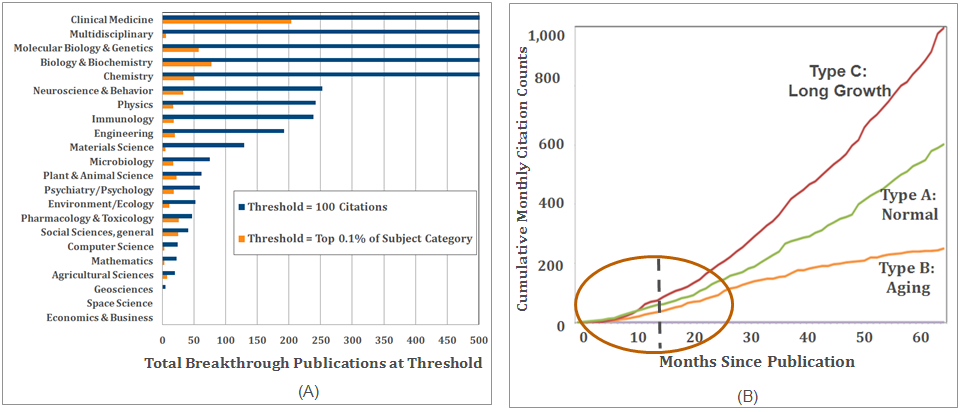
Based on our analysis, we defined a candidate breakthrough as a paper in the top 0.1% of cited papers within the same subject category during the same time period [see Figure 1(A)]. Our analysis of publication data sets for earlier years 1999-2004 shows that threshold values are almost time-independent. This threshold value is high enough to be selective, but for some areas with lower publication volume it may be desirable to increase the threshold to 0.5%. The numeric value of threshold depends strongly on publication volume and citation behavior, which can vary substantially by field of research.
The next step of our detection algorithm was identifying patterns of citation curves using monthly citation rate. In general, a typical citation curve has an initial period of slow citation growth (indicated by oval in Figure 1 (B)) lasting from 5 to 20 months. After this initial slow growth phase, there are three typical patterns [see Figure 1 (B)] of citation trajectories: linear growth (type A – approximately 50% cases), sub-linear (type B – 25%) and super-linear (type C – 25%).
Based on our observations we developed a fitting model that allows us to predict most citation trajectories with a minimum number of fitting parameters. We used the 2005 data set to optimize the detection time window. We found that 12 to 24 months provide sufficient time to identify the citation pattern evident at 5 years. For example, for a 24 month detection window we identified candidate breakthroughs with 68% precision and 77% recall. We also are able to identify candidates at 6 months with high precision. From these findings we have developed two Breakthrough Indicators: Instantaneous breakthrough candidates (6 months of citation data) and Long term breakthrough candidates (24 months of citation data).).

