Extended Abstract – FUTURE-ORIENTED TECHNOLOGY ANALYSIS session at “1st Global TechMining Conference” 2011
Author(s): Shu Fang, Zhengyin Hu, Hongshen Pang, Xian Zhan (The Chengdu Branch of the National Science Library, Chinese Academy of Sciences)
We propose an improved analysis method based on an existing method (Young,Jong & Sang, 2008) of patent semantic analysis for emerging technologies. We selected the field of graphene sensor for empirical analysis, and drew semantic networks of technology keywords and technology evolution maps of graphene sensor. The empirical analysis result shows that this new method can support better patent analysis of technology evolution.
Methodology
- Firstly, build a set of patent documents.
- Secondly, extract keywords of technology and invite experts to select the most important keywords.
- Thirdly, cluster the patent documents using patent classifications. The fuzzy similarity matrix of patent classifications-patent documents is the basis of clustering. We consider the distribution of patent classifications in patent documents and the semantic relations between patent classifications at the same time for matrix assignment (Shi & Yang, 2007). This is our key improvement.
- Fourthly, form semantic network of keywords. After clustering, we count the technology keywords in each group. If a keyword appears in more groups, we will move it to a new node with higher level and draw directed line segments between the new node and the others.
- Lastly, draw technology evolution map with horizontal axis of timeline and vertical axis of technology keywords frequency.
Empirical Analysis
- Firstly, we selected the database of Derwent Innovations Index for analysis and invited experts to determine the patent retrieval strategy and got 80 patent documents.
- Secondly, we extracted the keywords from the patent text fields (including title, abstract, technical focus) and invited experts to pick out the important technology keywords of graphene sensor as the base for the next technology evolution analysis.
- Thirdly, we used DMC for patent documents clustering. We counted out that there were 670 DMC contained in selected patent documents. Based on the similarity matrix of patent documents, we divided the patent document into 11 cluster groups by using hierarchical clustering.
- Fourthly, we counted the technology keywords in each clustering group and drew the semantic network of keywords.
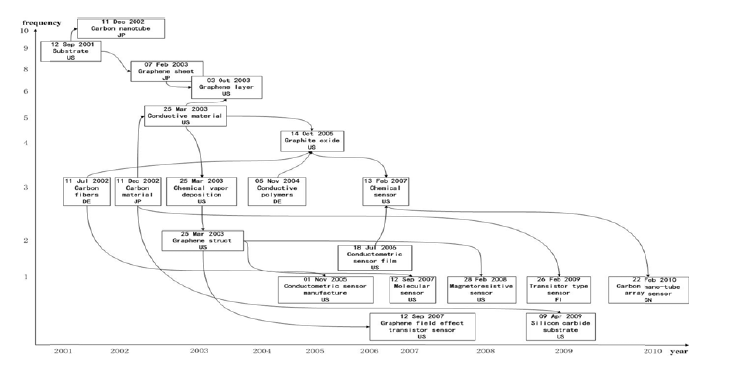
- Finally, we drew the technology evolution map of graphene sensor with horizontal axis of timeline and vertical axis of technology keywords frequency as follows:
- The technologies in the upper left corner of evolution map appear in many different technology groups and patents were applied for early. They can be considered as the basic technologies in the field of graphene sensors, such as substrate, carbon nanotube, graphene sheet, etc.
- The technologies in the lower right corner of the evolution map appear in fewer technology groups and patents were applied for later. They can be considered as the latest technologies or emerging technologies.
- With the time sequence, the directed line segments between technologies can reflect some evolutionary trends to a certain degree. Preceding technology nodes and the subsequent technology nodes belong to the same clustering group. The relationship between these two kinds of technologies reflects the following evolutionary trends:
- A preceding technology divides into different subsequent technologies.
- Several preceding technologies merge into subsequent technologies.
- The preceding technologies are applied in the subsequent technologies.
Future Work
In the future we will focus on how to formulate quantitative criteria that helps experts to pick out keywords more accurately and reduce difference of subjective judgments. Also we will apply our approach to other technologies for technology evolution analysis and check it effectively.

