Extended Abstract – EXTENDING TECHMINING METHODS session at “1st Global TechMining Conference” 2011
Author(s): Ivana Roche, Maha Ghribi, Nathalie Vedovotto, Claire François, Dominique Besagni, Pascal Cuxac (INIST-CNRS); and Dirk Holste, Marianne Hörlesberger, Edgar Schiebel (Austrian Institute of Technology)
Identifying the evolution trends of a scientific domain can be hugely interesting for the scientific research policy makers. The evolutions of a scientific domain can be studied by associating clustering techniques, generating a representation of the publication scientific landscape based on its extracted terminology, with a diachronic analysis of clustering results obtained at two different times. This work, developed in the context of a European project, aims to propose an alternative way by producing an assisted diachronic analysis of clustering results decreasing the load of the expertise phase.
Data. The data sets have been extracted from PASCAL, a multidisciplinary bibliographic
database produced by the Institut de l’INformation Scientifique et Technique (INISTCNRS) by indexing scientific publications. They focus on the specific field “Systems and Communications Engineering: electronic, communication, optical and systems engineering”.
Methodology. Two corpora have been extracted from PASCAL, over two publication years: 2000 (20568 elements) and 2009 (19827 elements). The clustering algorithm enables to map each corpus in clusters of similar records with respect to the keywords existing in the bibliographic references. The employed clustering tool applies a nonhierarchical clustering algorithm, the axial K-means method, coming from the neuronal formalism of Kohonen’s self-organizing maps, followed by a principal component analysis (PCA) in order to represent the obtained clusters on a 2-D map. A diachronic analysis of the clustering results is then operated, on one hand by means of the huge expertise task consisting on the examination of each cluster content and relative position in the cluster networks of each period and, on the another hand, by the evaluation of the relationships between clusters of the two periods, employing the association rules (classical or fuzzy [1, 2, 3]) through the “confidence index” Cf .
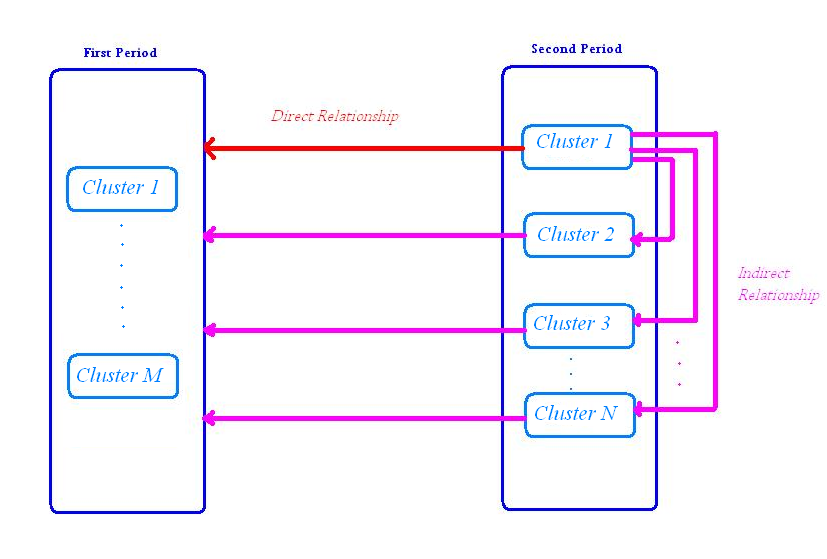
Logically, the relationship between two clusters which are considered as close to each other has high confidence indexes. So, an innovative cluster of the second period must show small confidence indexes with regards to each cluster of the first period. In this work, we calculated two different indexes: one measures, for each cluster of the second period, the minimum Cf value among its relationships with each cluster of the first period. It thus evaluates the direct relationship between the two periods. We call it “InterP”. The other index is called “IntraP”. It takes into account the relationships between clusters of the second period. It allows us to verify on one hand whether these clusters are strongly linked together and, on the other hand, if they have potential indirect relationships with the first period, which would not have been detected with “InterP”. Figure1 illustrates the direct and indirect relationships between the clusters of the second period and those of the first period. IntraP is calculated by using a weighting function, so that the contribution of highly linked clusters is bigger than that of weakly linked ones. The global value of innovativeness, or positive dynamic changes, is the harmonic mean of IntraP and InterP. Considering the calculated values, a decreasing ranking of the second period clusters is established.

The next step consists on assigning to a new element (proposal) the nearest clusters in the second period map. The closer the new element is to clusters of positive dynamic changes, the more innovative it is. The clusters are represented by keywords. The classification method assigns to each cluster and for each keyword a value that evaluates how much the cluster could be described by this keyword (we can call it “weight”). So each cluster is represented by a non-binary vector, while each new element is represented by a binary one. Therefore, neither the Euclidian distance nor the cosine similarity is very useful to calculate the proximity between the proposal and the clusters. The idea is then to assign to the proposal the cluster whose keywords represent it at best. In this objective, we study the distribution of the weights in the cluster and evaluate the cumulative distribution function (CDF) corresponding to the values of the proposal’s keywords. For a keyword that possesses a weight w in a cluster c , the CDF(w) is the proportion of keywords whose weight is at most w in c . If CDF(w) is near to 1, this means that this keyword is highly significant in this cluster and represents it well. The similarity value between a proposal and a cluster is the mean of the values of CDF of the keywords that appear in the proposal as well as in the cluster.
Results. We observe a real convergence between the results obtained with the assisted
diachronic analysis and those operated by the expert. With the help of a test set, the expert has also validated the procedure of positioning of new elements. The next validation step will be the application of our complete procedure to another scientific field. A detailed presentation will be available in the full paper that will come soon.
Bibliography
1. J. Han and M. Kamber, “Data Mining : Concepts and Techniques”, San Francisco : Morgan Kaufmann Publishers, 2001
2. D. Hand, H. Mannila and P. Smyth, “Principals of Data Mining”, Cambridge, Massachusetts, USA: The MIT Press, 2001
3. P. Cuxac, M. Cadot and C. François, “Analyse comparative de classification: Apport des règles d’association Floue” In EGC 2005, pp. 519–530
