Extended Abstract – MINING NOVEL DATA SOURCES session at “1st Global TechMining Conference” 2011
Author(s): Benjamin Y. Clark, Sung-Gheel Jang, Jeffrey Brudney (University of Cleveland)
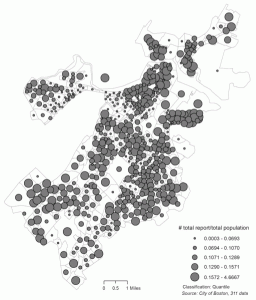
New technologies are allowing governments to harness a complex flow of data to address a vast array of problems by using the public’s collective wisdom. Through such “crowdsourcing,” governments are able to collect citizen-generated data in “311” systems—i.e., quasi-“411” systems that allow citizens to provide non-emergency information and requests directly to governments via advanced telephone systems. The primary goal of this research is to investigate the distributional impacts of governments relying upon 311 systems to allocate resources. Our analysis is based on one year of service requests in the City of Boston—from February 2010 to February 2011.
These requests were generated either internally by city employees or externally by citizen requests (via phone, internet, or smartphone app). We have linked these data with US Census block group to obtain information on population size, race, gender, and household wealth. These data are drawn from both 2010 Census and the American Community Survey.
We have two hypotheses for this paper. H1 is that historically disadvantaged groups will be less likely to use 311 systems and thus less likely to benefit from them. Our second hypothesis (H2) is that as 311 expands to internet and smartphone reporting, the disparities will exacerbate the problems of unequal reporting of, and responses to, citizen-demanded services.
To investigate the hypotheses we use GIS mapping, cluster analysis, and statistical modeling. Using spacial analysis via GIS we calculated the density of services requests by neighborhood. All three methods of citizen input are show to have similar distributions, with concentrations in particular neighborhoods. Department (internal) reports are more evenly distributed across the city. We also examine the global spatial clustering (i.e., spatial autocorrelation) by submission type or channel. To assess the overall spatial clustering, the global Moran’s I statistic was estimated. For all channels the results suggest significant and positive spatial autocorrelation—meaning that reported cases are clustered in non-random ways. As the project progresses we will further investigate to identify where the spatial non-randomness (spatial clusters) may be located by employing the local indicator of spatial association (LISA) method.
We use six Poisson regression models to test the two hypotheses. Our dependent variable is these models is the number of service requests within a block group. Each of the six models uses a different count of service requests as its dependent variable, they are: all requests, internal requests, external (or citizen-generated) requests, telephone requests, Internet requests, and smartphone requests. The unit of analysis in these models are the 2010 Census block groups.
The preliminary results indicate the following:
Hypotheses One:
1) Race : The three broad models (predicting all requests; internal requests; and external/citizen requests) show differing results in the predicted number of service requests. The all request and citizen-generated models show that as the proportion of minorities within a block group increase, the total number of requests decrease. The internally generated requests, shows the opposite effect—increasing minority
population leading to more predicted service requests.
2) Education: Education, measured as the proportion of block group residents with a high school diploma or GED, is demonstrated to be a positive influence on the number of service requests. This variable is significant in only the ‘all requests’ and ‘internal requests’ models.
3) Wealth:Across all three broad models a pattern of lower income (proportion of households with income less than $25k) predicts a smaller number of service requests. And similarly, as the proportion of higher income ($100k plus) population increases the predicted number of service requests also increases. At income levels between the upper and lower levels, when significant, the results indicate that rising income predict more service requests.

Hypotheses Two:
1) Race: The magnitude of the effect of an increasing minority population shows that internet/smartphone-based reporting exacerbates the disadvantages to minority groups when compared to the more “traditional” telephone-based system.
2)Education: The models for H2 do not show a consistent effect of eduction, thus they do not provide a clear predicted impact of education.
3) Wealth: The model looking at the predicted number of CitizensConnect generated requests indicates that as the proportion of households in the two lowest income categories (less than $25k and 25k to $50k) increase, so do the number of service requests. This is the only service request method type in which these income groups are demonstrating a positive influence on predicted service requests. The hotline and internet-based systems both show low income (less than $25k) predicting a lower service request volume, and the higher income predicting a higher service request level.
How should we interpret these findings? A racial division may affect how Boston’s system’s benefits are distributed. This tentative finding should not be read as an accusation of racial bias against the City in its implementation of the Mayor’s Hotline or Citizens Connect. Rather, it likely points to larger issues of trust and faith in government to respond on the part of citizens. If the system is to have a broader appeal and use in the city, addressing the underlying issues of trust in government would appear to be important. It could also be a result of how the program has been marketed and advertised. Perhaps more resources need to be allocated to neighborhoods with a larger minority population to inform them about the program. And furthermore, it could be a sign of a lack of access to technologies in these neighborhoods. Perhaps one of the more compelling findings of the analysis is that the smartphone seems to be providing an outlet in neighborhoods with lower income populations to inform government to address their service needs. This finding may be an early indication that the digital divide can be surmounted with the further introduction and penetration of smartphones across all income levels.
Login to view.